| Contributor to penguinV |
| Repository |
https://github.com/ihhub/penguinV |
|
| Language |
C++ |
|
| Purpose |
An image processing library focusing on ease of use and heterogeneous systems (e.g. CUDA). |
|
| Description |
My contributions to this project include:
|
|
|
| TSP_PictureMaker |
| Webpage |
https://matthewmcgonagle.github.io/TSP_PictureMaker/ |
|
| Repository |
https://github.com/MatthewMcGonagle/TSP_PictureMaker |
|
| Language |
Python |
|
| Purpose |
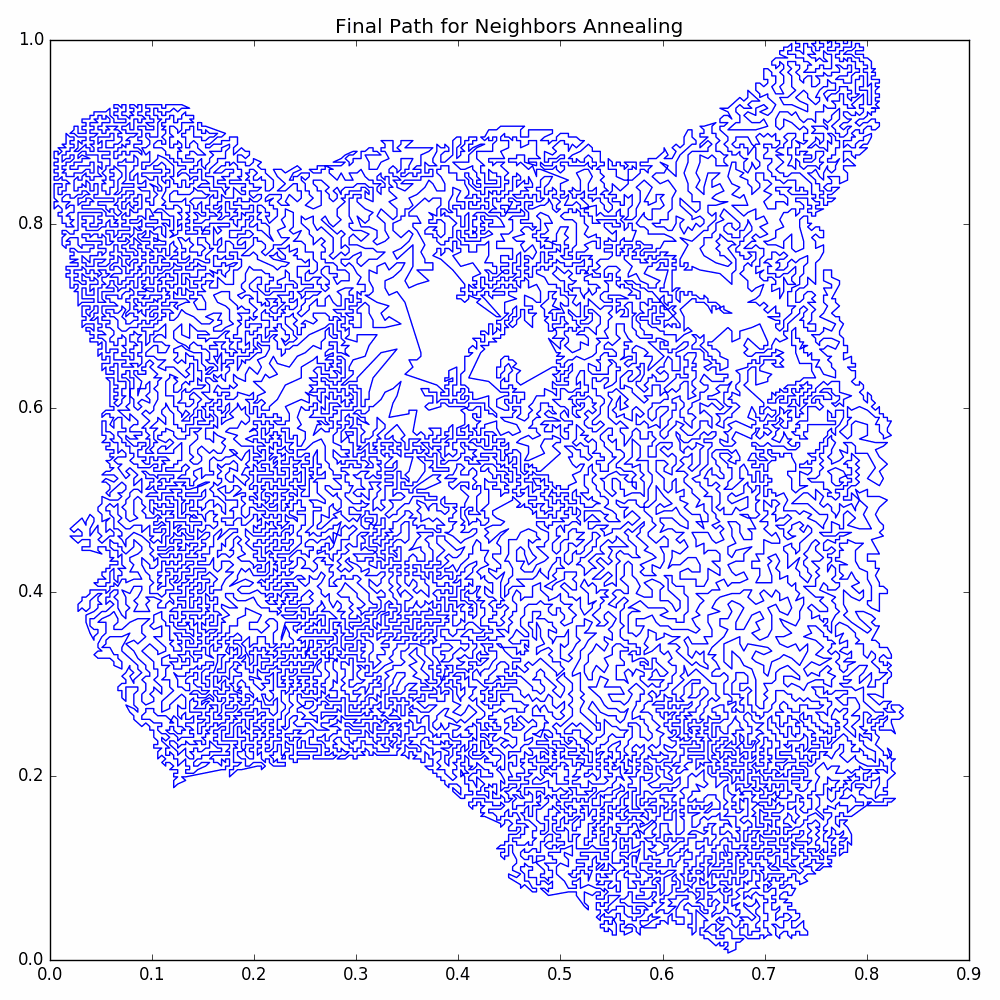
Python module for drawing pictures using a single closed curve with a small number of self-intersections by finding approximate solutions to the Travelling Salesman Problem. |
|
| Description |
This module turns an image into a drawing using a single curve with a minimal amount of self-intersections by doing the following:
-
Convert the image to gray scale.
-
Use dithering to turn the image into a black and white image. The resulting black pixels give the vertices that the curve will visit.
-
Use multi-stage simulated annealing to find an approximate solution to the Travelling Salesman Problem for the extracted vertices. This
approximate solution gives us the curve we use to make the drawing.
Below is an example of the type of drawing that can be made:
|
|
|
| Kaggle Santander Customer Transaction Prediction |
| Repository |
https://github.com/MatthewMcGonagle/kaggle_competitions/tree/master/santander_2019 |
|
| Language |
Python |
|
| Purpose |
Predict the probability that a customer transaction will be repeated based on 200 un-labeled features. |
|
| Description |
We predict a probability for the binary classification problem of no repeat (class 0) and repeat (class 1).
There are many more samples in class 0 than class 1, so we score using Area Under the Receiver Operating Characteristic Curve metric
(instead of accuracy).
Model Steps
- Due to data size, use out-of-core training to train custom dimension reduction transformers
using mini-batches of the data. The transformers pick out optimal directions based on the
ratio of in-class variances for each class. They also use the difference between the in-class means.
Here is a graph of the reduced features for a training fold of the cross-validation:

- Use cross-validation to pick out a final predictor. We found that simple Linear Discriminant Analysis serves
as a good predictor on the final reduces features. Here are the graphs of the cross-validated ROC curves:

The mean cross-validated area under the ROC curve was about 0.85 out of a maximum score of 1.0.
- Use JSON encoding/decoding to create model persistence to allow us to make predictions on test data set in
in another Jupyter Notebook.
- Decode the JSON version of the model to make transform and make predictions of the kaggle test data set.
|
|
|
| CVWriter |
| Webpage |
https://matthewmcgonagle.github.io/CVWriter/ |
|
| Repository |
https://github.com/MatthewMcGonagle/CVWriter |
|
| Language |
Haskell |
|
| Purpose |
Create two output formats for a CV based on one input file of CV information. |
|
| Description |
Library that parses a file with a particular XML-like formatting that contains information to put into a CV. The format is discussed in the README.md located in the repository.
After parsing, this information can be converted into two different file formats: a .html Jekyll compatible file or a .tex LaTeX file.
- The .html file is meant to be processed by Jekyll to create a web-page CV. I use this to make
the webpage version of my CV .
- The .tex LaTeX file is meant to be processed using
pdflatex to create a .pdf version of the CV.
I use this to make the pdf version of my CV.
|
|
|
| Quadratic Field Extension |
| Webpage |
https://matthewmcgonagle.github.io/QuadraticFieldExtension/ |
|
| Repository |
https://github.com/MatthewMcGonagle/QuadraticFieldExtension |
|
| Language |
C++ |
|
| Purpose |
Do infinite precision arithmetic for numbers that are made of fractions and any number of square roots.
For example, numbers such as 1 + sqrt(1/2 + sqrt(2)), where sqrt() is short for the square root function.
|
|
| Description |
Handles arithmetic for numbers created from fractions by applying any number of square roots. For example, numbers such as
1 + sqrt(2) or 1/3 + 2 * sqrt(1/2 + sqrt(2)), where sqrt() is the square root function.
Library allows one to keep adding square roots of previously added numbers to perform operations. For example, the class starts off with
handling only fractions. One could then add sqrt(2) to the numbers the class can handle; note that sqrt(2) is
NOT a fraction (this is a math fact). Now the class can handle numbers like 1/3 + 2/3 * sqrt(2) .
You can then increase the numbers handled by the class by adding a new square root. For example, you could add sqrt(1 + sqrt(2)).
Now the class can handle numbers such as 1 + 3 * sqrt(1 + sqrt(2)) + 3/5 * sqrt(2) * sqrt(1 + sqrt(2)). Note that the root we
added, sqrt(1 + sqrt(2)) isn't expressible in terms of the numbers previously handled by the class (again, another math fact).
The class can also determine if the square root of one the numbers it can handle can be expressed as a number it can already handle.
For example, sqrt(6 + 2 * sqrt(2)) = 2 + sqrt(2), so we don't need to add more numbers to the class to deal with
sqrt(6 + 2 * sqrt(2)). When the class can find a square root in terms of numbers it already knows, then it is capable of
telling you the square root.
|
|
|
| Hilbert Draw |
| Webpage |
https://matthewmcgonagle.github.io/HilbertDraw/ |
|
| Repository |
https://github.com/MatthewMcGonagle/HilbertDraw |
|
| Language |
Python |
|
| Purpose |
Convert a picture to a representation made of different levels of Hilbert pseudo-curves. |
|
| Description |
The Hilbert curve is a space filling curve, i.e. a continuous curve that fills an entire square. The Hilbert curve is constructed using
different levels of Hilbert pseudo-curves, which have a fractal-like self-similar nature.
The library turns a picture (e.g. a .png file) into a representation using one continuous non-self intersecting curve
whose sections are different levels of Hilbert pseudo-curves. This works best for pictures of cartoon like subject that
don't have too much detail. This best seen using an example picture.
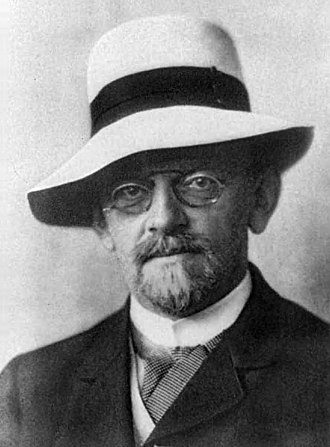
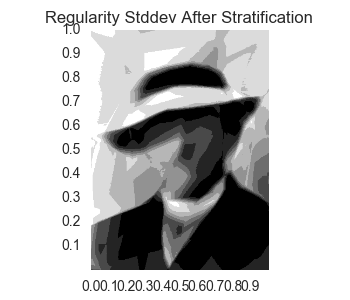
For example, consider the following (manually edited) cartoon-like picture of the mathematician David Hilbert and its
conversion using the library:
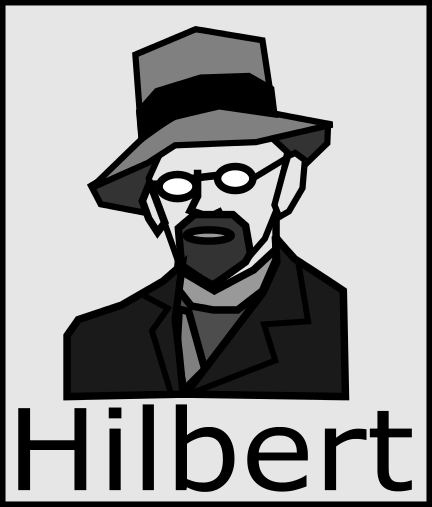
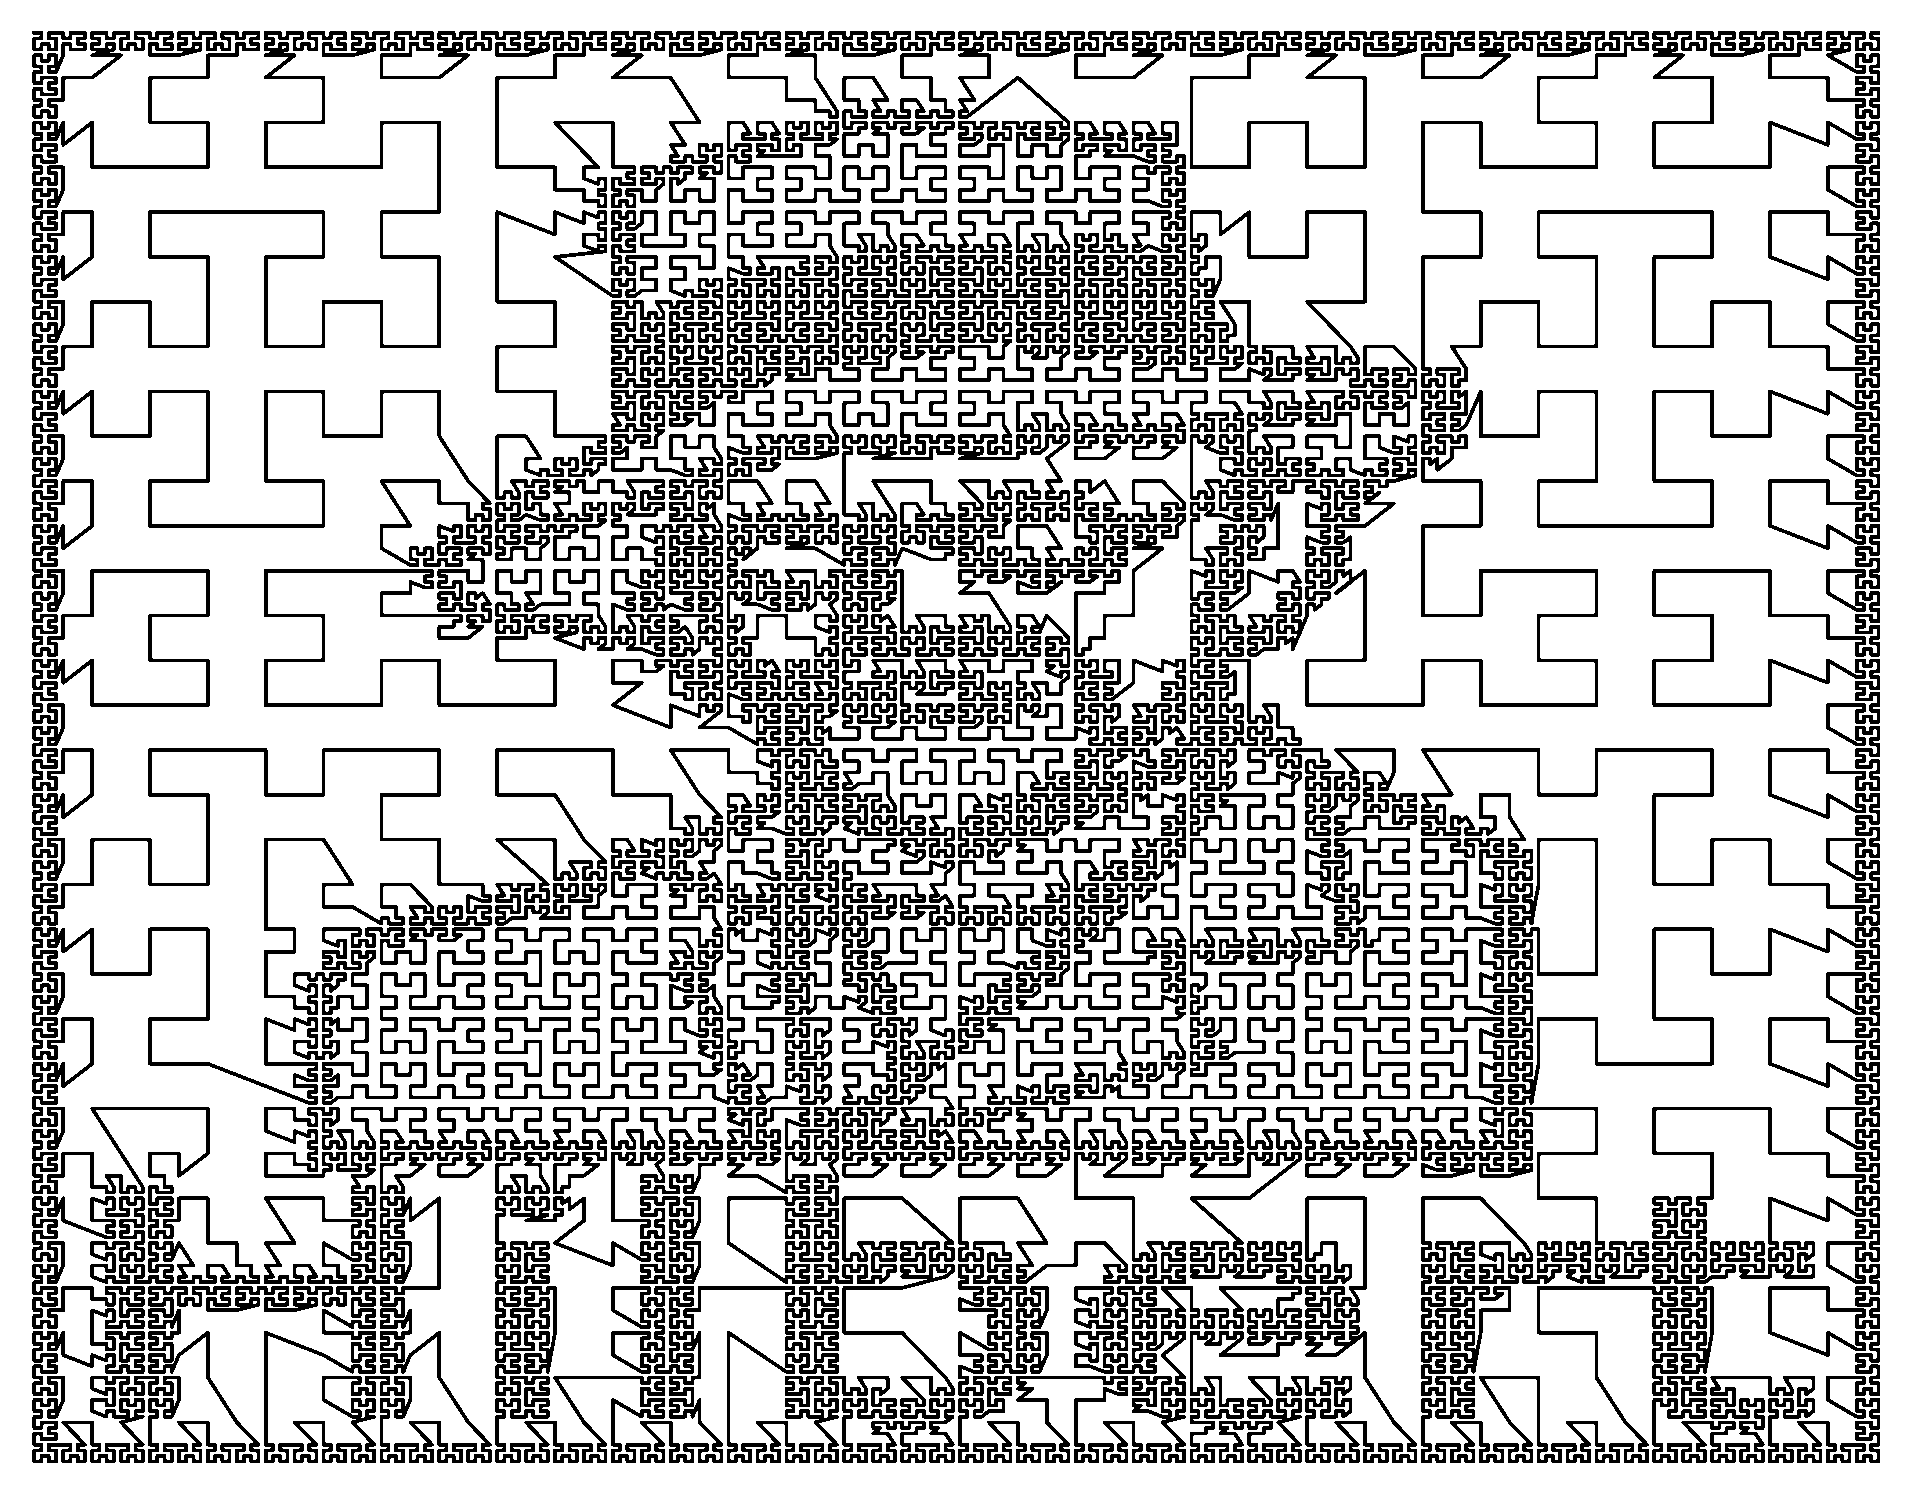 The images have been resized for putting in this table.
The fullsize cartoon image
and the the fullsize conversion
are available inside the repository.
The images have been resized for putting in this table.
The fullsize cartoon image
and the the fullsize conversion
are available inside the repository.
|
|
|
| Programming Exercises |
|
|
| Blog |
| Webpage |
https://matthewmcgonagle.github.io/blog/ |
|
| Purpose |
Short articles on programming, math, and data science. |
|
| Description |
Noteworthy Posts:
- 30 Oct 2017 - Picture Effects in Tensor Flow
Treat a picture as a function of two variables x and y. Then try to learn this function using a neural network in
tensorflow to create a picture effect. For example, the original picture of David Hilbert is on the left;
the picture effect is on the right:
- 21 Nov 2017 - Random Traversal of a Binary Tree
Uses numerical simulation to verify theoretical statistics of traversing a binary tree where at each node we independently
and randomly choose between preorder traversal, inorder traversal, or postorder traversal. Here is an example of the
agreement between the simulation and the theoretical:

- 08 Dec 2017 - A Pitfall of Errors in Parsec Package for Haskell
Discussion of parsing error messages when using the Parsec library and how to avoid a mistake that will cause your parsing error
messages to be misleading.
- 03 Nov 2017 - Drawing a Binary Tree Using Gradient Descent and a Potential Function
Use gradient descent to take find an optimal way to space out nodes of a large binary tree so it is drawn neatly and clearly.
The final form is given below (although it is a little squeezed horizontally, the graph was made for a space wider than this column):

|
|